Visualizing the Collapse of Canada’s Third Parties in 2025
In Canada’s 2025 federal election, something remarkable happened — and you can see it clearly in a triangle.
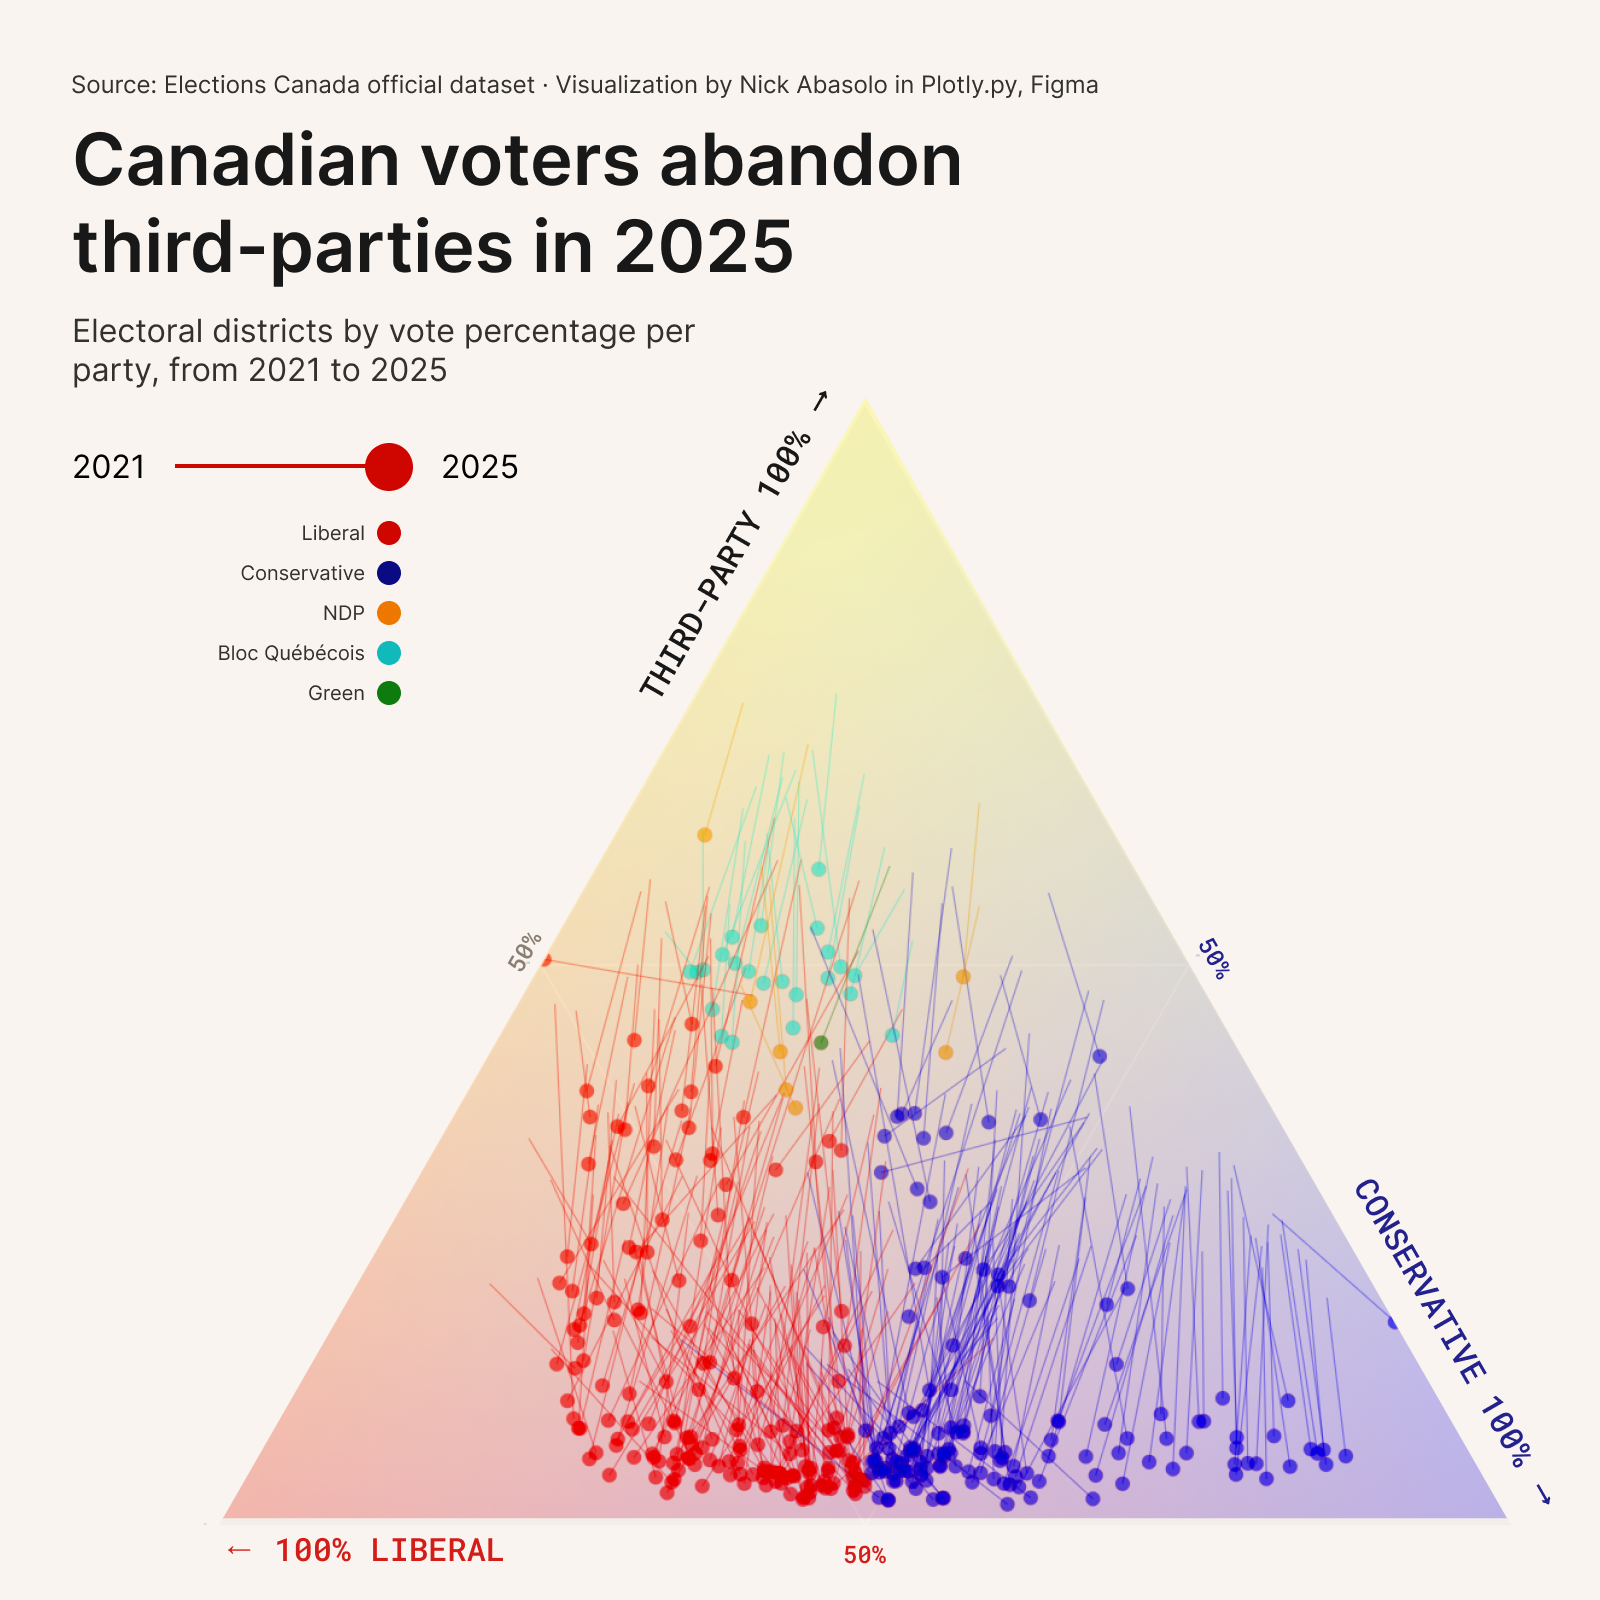
I created a ternary plot to visualize how vote shares shifted across every federal riding from 2021 to 2025. In this chart, each corner of the triangle represents one of three broad political categories: Liberal, Conservative, and Third Parties (a bucket combining the NDP, Bloc Québécois, and Greens). The closer a point is to a corner, the more dominant that party’s vote share was in that riding. Each line connects the same riding between 2021 and 2025 — showing the direction and magnitude of the political shift.
A Downward Drift
What emerged was a clear pattern: most lines drift downward, away from the third-party corner. Voters across the country moved away from smaller parties and toward the two dominant ones — Liberals and Conservatives. But they didn’t do so evenly.
On average, third-party support fell by 19 percentage points. The Liberals picked up 11 points, and the Conservatives gained 8. That 3-point edge helped push the Liberals ahead in many ridings — but the broader story is one of convergence. Voters didn’t simply swing left; they realigned toward the poles of power.
Tactical Voting or a Larger Realignment?
We might expect left-leaning voters to consolidate behind the Liberals in a bid to stop Conservative gains — a familiar theme in Canadian elections. But the data shows something more nuanced. The swing away from third parties fed both the Liberals and Conservatives. In 317 out of 343 ridings, third-party support dropped while Liberal support rose — but in many of those ridings, the Conservatives surged too.
The result is a landscape where the middle collapsed. The race narrowed — but not necessarily in ways that favoured one side as dramatically as you might expect.
A Note on the Data
Because of redistricting between elections, the 2021 results were transposed onto the new 2025 boundaries using Elections Canada’s official redistribution data. That means all comparisons are apples-to-apples, using the same map.
The plot was created using Plotly in Python and cleaned up in Figma for clarity.
